
Total Modules: 7
Gain insight into a topic and learn the fundamentals.

Duration
24 hours

Level: Beginner
No prior experience required

Internship
Be eligible for internship (paid/unpaid)

Fee: USD
400USD 320
Hurry! First batch intake closes on 20 Fab 2026 — only 5 internship spots left!
Skills you'll gain
Positioning Strategies
Develop data-driven marketing positioning frameworks.
Advanced Excel
Master Excel tools for efficient marketing data analysis.
CLTV and RFM Analysis
Optimize customer retention using RFM and CLTV methods.
Python for Analytics
Automate data analysis with Python and Jupyter Notebook.
A/B Testing Expertise
Design and analyze A/B tests to optimize marketing campaigns.
Data Visualization
Build compelling, insightful visual representations of data.
Exploratory Data Analysis
Extract insights by analyzing and interpreting datasets.
Industry-relevant Skills
Real-world professional experience through an internship*.
Tools and Platforms covered
Program Overview and Structure
1. Getting Started
Understand the importance and applications of data visualization in analytics. Learn about different tools used for data visualization, with a focus on Tableau, and get familiar with the Tableau interface.
- Introduction to Data Visualization
- What is Data Visualisation
- Why do we need Data Visualisation
- Applications of Data Visualization in Data Analytics
- Different tools used for Data Visualization
- Introduction to Tableau
- Different Products of Tableau
- Creating Profile on Tableau Public - Sign Up / Sign In
- Understanding the Tableau Interface
2. Data Connection and Preparation
3. Building Visualisations
4. Usage of Filters and Parameters
5. Calculated Fields in Tableau
6. Dashboards and Storytelling in Tableau
7. Advanced Features in Tableau
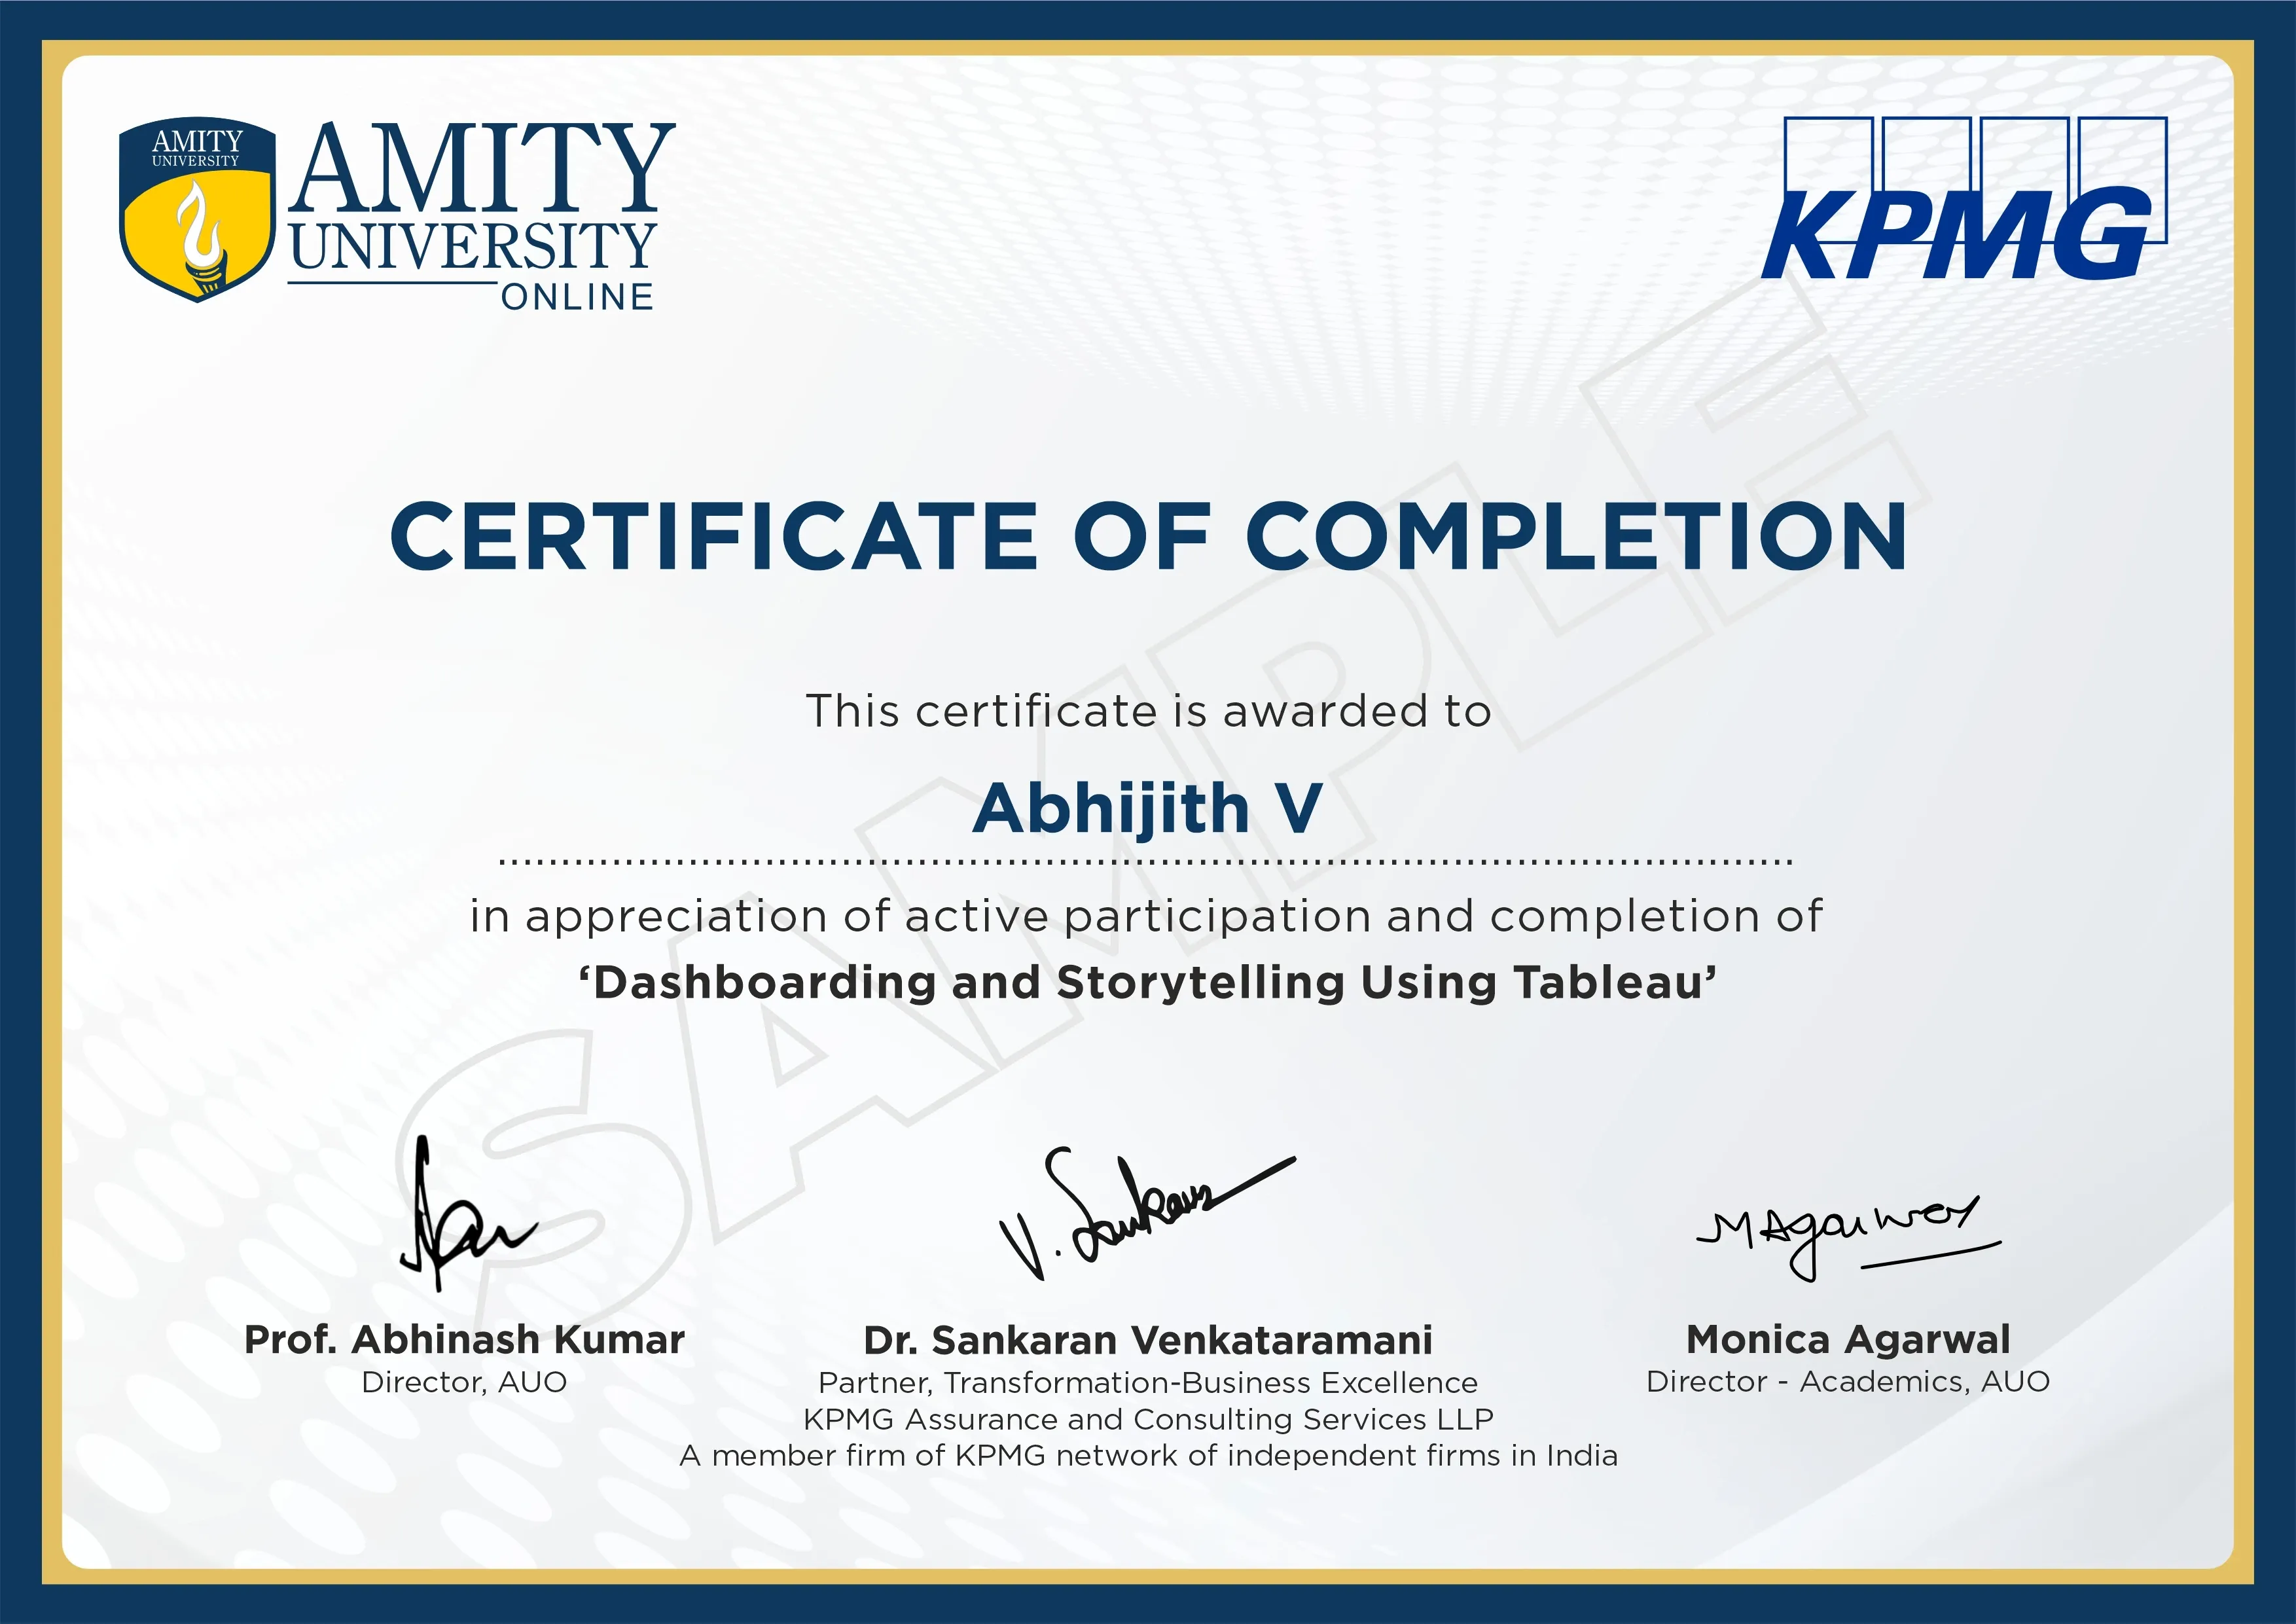
Earn and Share Your Certificate

Meet our top-ranked faculty

Kaushik Swaroop
Consultant Advisory-Transformation-BE, KPMG India
Amity Online Advantages: Why We're the Right Fit for You

Learn from Analytics Experts and Industry Veterans
Learn from experienced faculty and industry professionals who specialize in data analytics and business intelligence. Our experts help you build dynamic skills and knowledge that meet industry standards.

Real-World Case Studies and Data-Driven Projects
Gain hands-on experience in data visualization skills, helping you make informed decisions and drive impactful outcomes. This practical approach prepares you to make data-driven decisions in any business setting.

Flexible Learning for Busy Professionals
Study at your own pace with a flexible curriculum designed to fit around your schedule, making it ideal for working professionals looking to upskill.

Certification with Industry Recognition
Receive a certification in Dashboarding and Storytelling using Tableau from Amity University Online, respected by employers across multiple sectors.
Frequently Asked Questions
These certifications are unique because they focus on combining data visualization with storytelling techniques using Tableau, helping you present insights clearly and drive better business decisions.


Total Modules: 7
Gain insight into a topic and learn the fundamentals.

Duration
24 hours

Level: Beginner
No prior experience required

Internship
Be eligible for internship (paid/unpaid)

Fee: USD
400USD 320

